You can read an article about KyPlot from here .
The followings are main functionalities of KyPlot.
Changes in Version 6.0.2
1. Bug fixes
2. New functionalities
1) Spherical graphs (3D)
See samples file: SpherG
2) 3D map graphs
See samples file: Map3DG, Map3DList
New functionalities in Version 6.0.1
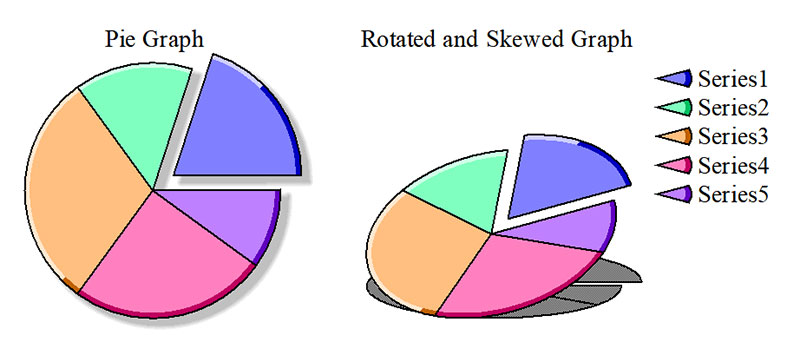
1) 2D and 3D pie graphs
See samples file: PieG
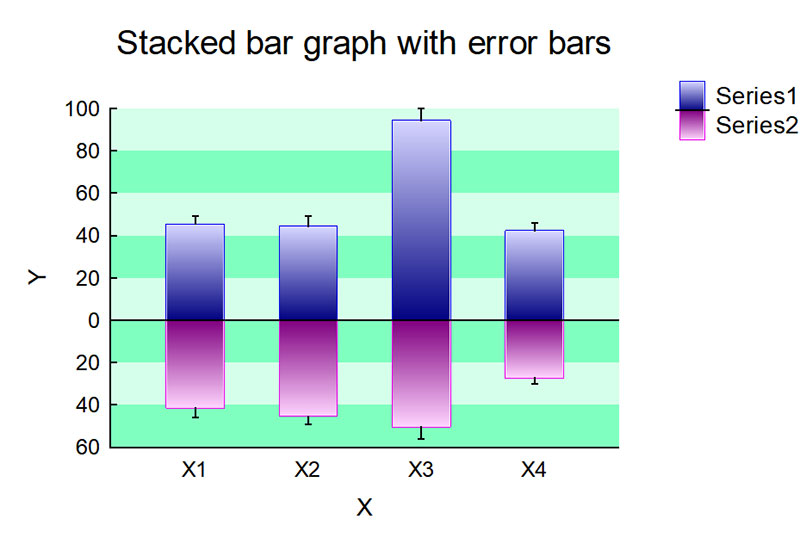
2) Scatter bar graphs (2D and 3D clustered bar/stacked bar graphs)
See samples file: ScatterBarG
3) Other samples
Graph templates for USA states data: MapUSAAreas and MapUSABars
New functionalities in Version 6.0.0
See samples files: MapG, MapList and MapWorld.
See also graph templates for Japan prefecture data: MapJapanAreas, MapJapanBars, MapJapanCompactAreas, MapJapanCompactBars and MapJapanCompactPolygons.2) Cylindrical graphs: cylindrical line/scatter/area graphs, cylindrical mesh graphs (surface /contour/column), cylindrical bubble graphs and cylindrical vector graphs
See sample file: CylindG.
Data analysis
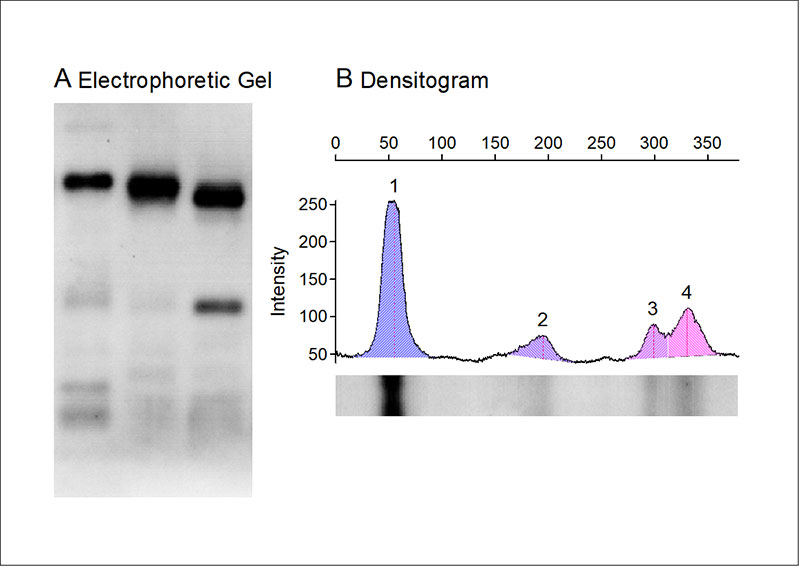
 •Spreadsheet calculations•Averaging and filtering of data•Removing a linear trend form time series data•Differencing, differentiating and integrating data•Creating histograms, cumulative distributions, regressograms of data•Estimating and plotting kernel densities of data•Measurement of peaks and areas•Matrix and vector operations•Numerical solutions of differential equations and integrations•Linear, quadratic and nonlinear optimizations•Convolution and deconvolution•One dimensional and two dimensional Fourier transforms•Spectral and time series analyses
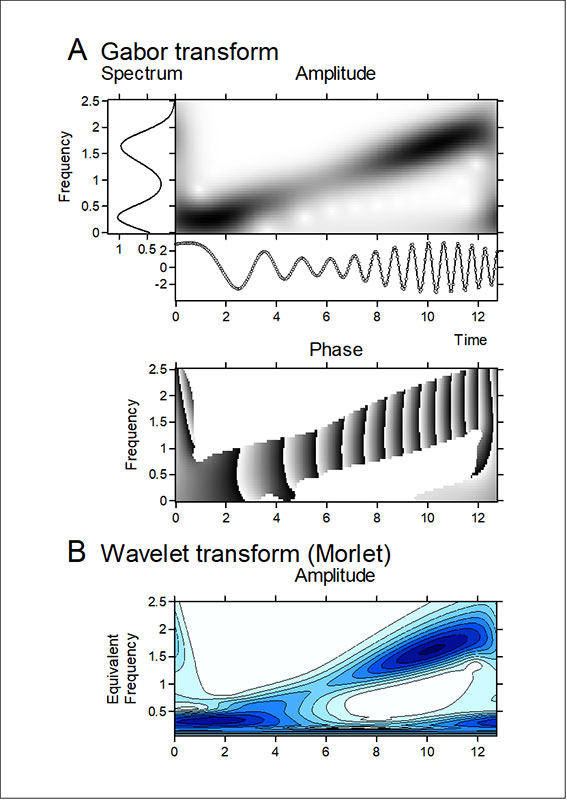
•Gabor transform and wavelet analysis
Statistical analysis
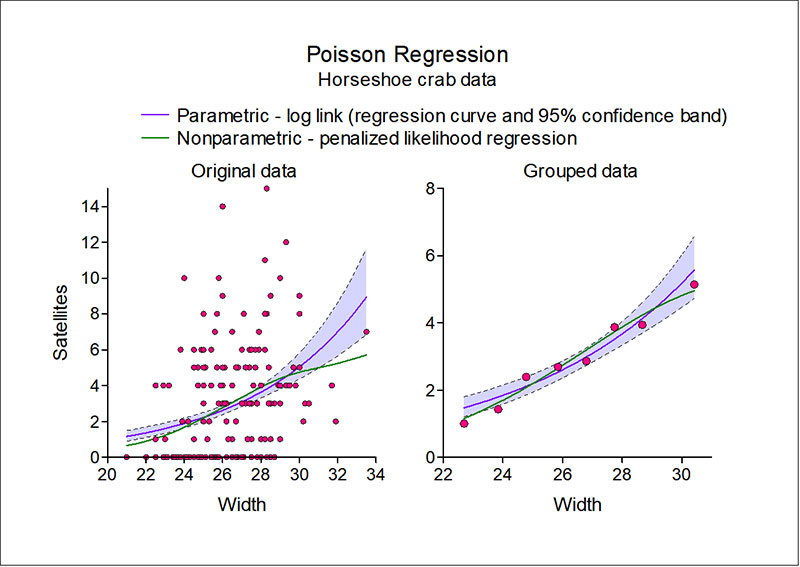
 •Descriptive statistics•Contingency tables•Parametric tests (linear correlation, t-test for unpaired or paired comparison, t-test for mean, Single factor ANOVA, Two factor ANOVA with or without replication, Single factor ANCOVA with one covariate or multiple covariates, Parametric multiple comparisons:Tukey and Dunnett tests, Smirnov-Grubbs test for outliers, Shapiro-Wilk normality test)•Non-parametric Tests (Spearman/Kendall rank correlation, Wilcoxon rank sum and signed rank tests, Kruskal-Wallis test, Jonckheere trend test, Friedman test with or without replication, Nonparametric multiple comparisons:Steel-Dwass and Steel tests, Kolmogorov-Smirnov test for one sample or two samples)•Regression analysis (Simple, polynomial and multiple regressions, Nonparametric simple regression, Parallelism test of 2 regression lines/Parallel line assay, Nonparametric test for parallelism of 2 regression lines)•Multivariate analysis (Principal component analysis, Factor analysis, Canonical correlation analysis, Discriminant analysis, Cluster analysis)•Generalized linear models (Univariate and multivariate logistic regressions, Probit analysis, Poisson regression)•Survival analysis (Weibull model, Proportional hazard model, Kaplan-Meier method, Life table method and Log-rank test/Generalized Wilcoxon test)
Graph
 [2D graph]
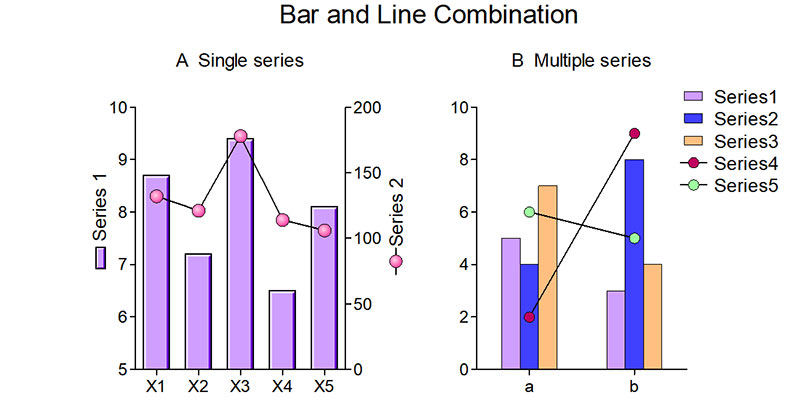
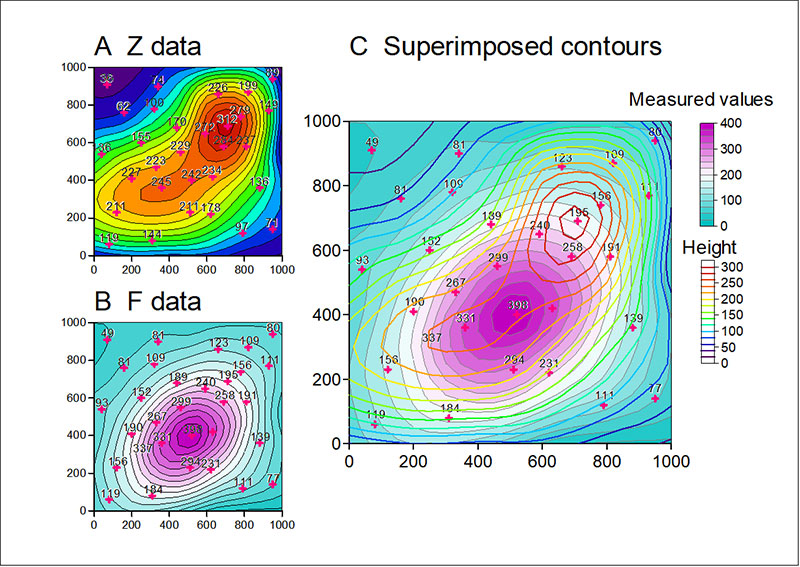
•XY Line/Scatter/Area, XY Mesh (Image/Contour/Surface), , XY Bubble, XY Vector
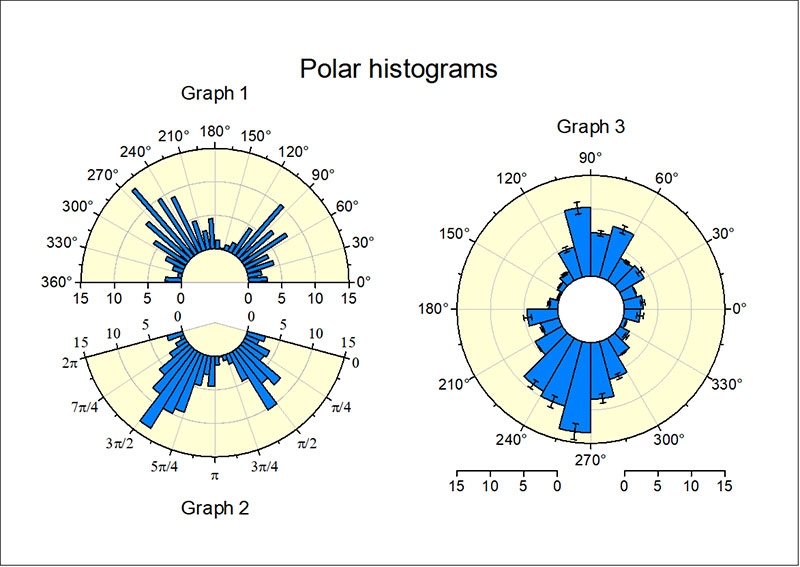
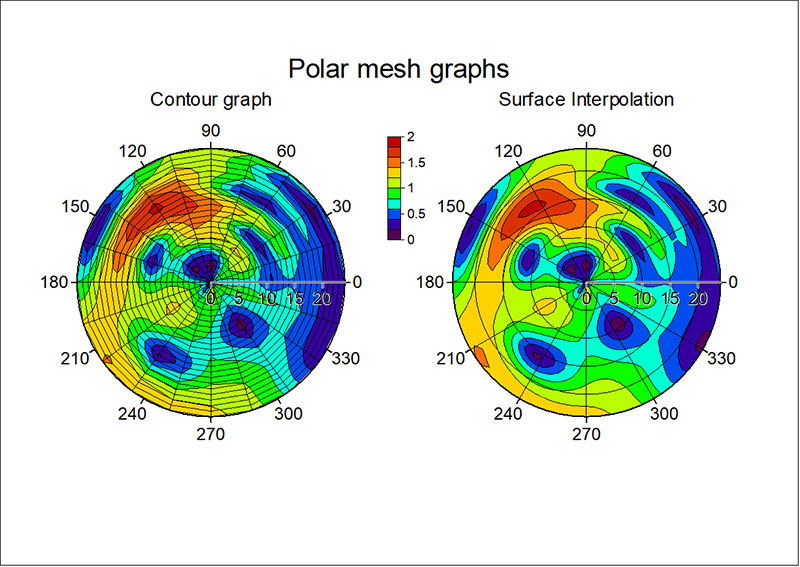
•Polar Line/Scatter/Area, Polar Mesh (Image/Contour/Surface), Polar Bubble, Polar Vector
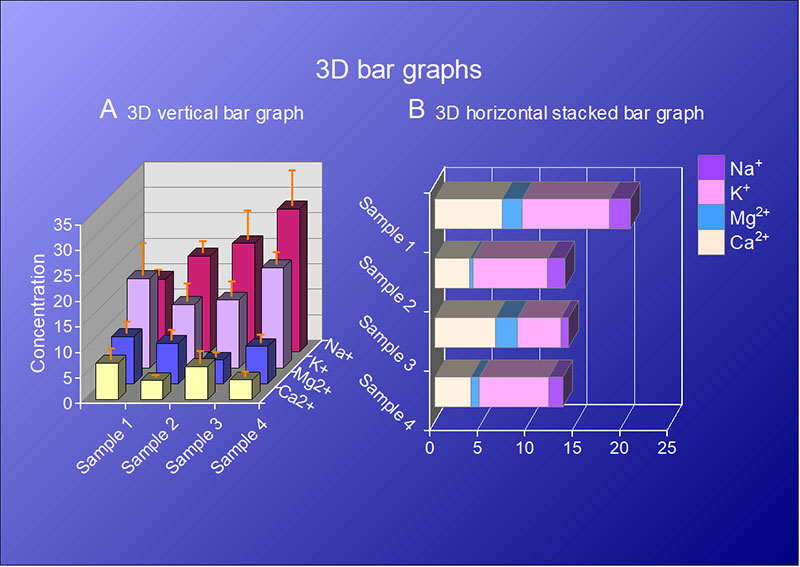
•Map Line/Scatter/Area, Map Mesh (Image/Contour/Surface), Map Bubble, Map Vector[3D graph]•Waterfall, 3D Bar, 3D Stacked Bar
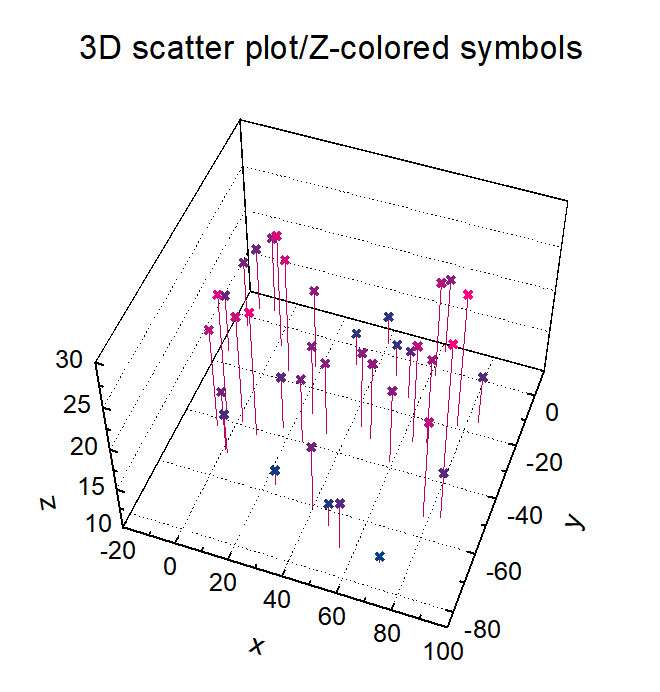
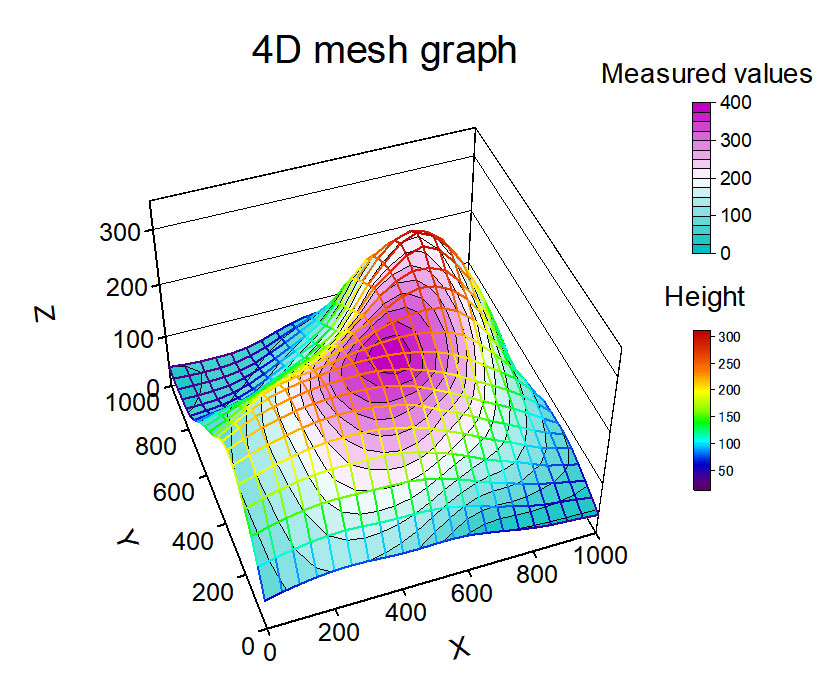
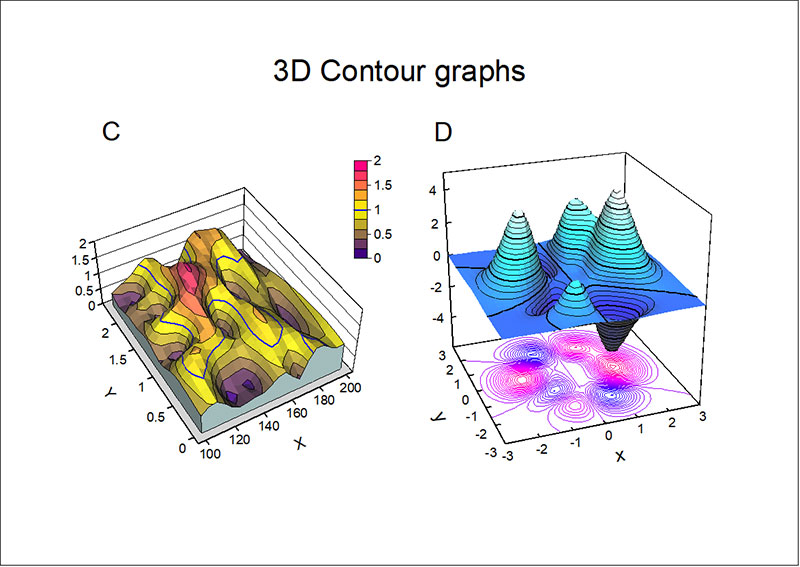
•XYZ Line/Scatter, XYZ Mesh (Surface/Contour/Column), XYZ Bubble, XYZ Vector
•Cylindrical Line/Scatter, Cylindrical Mesh (Surface/Contour/Column), Cylindrical Bubble, Cylindrical Vector
Graph fitting
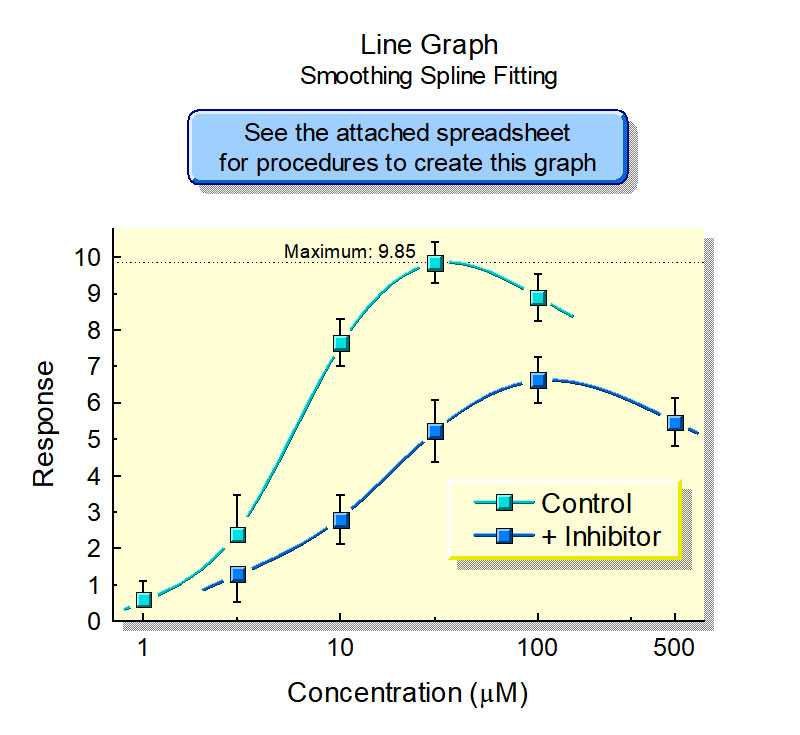
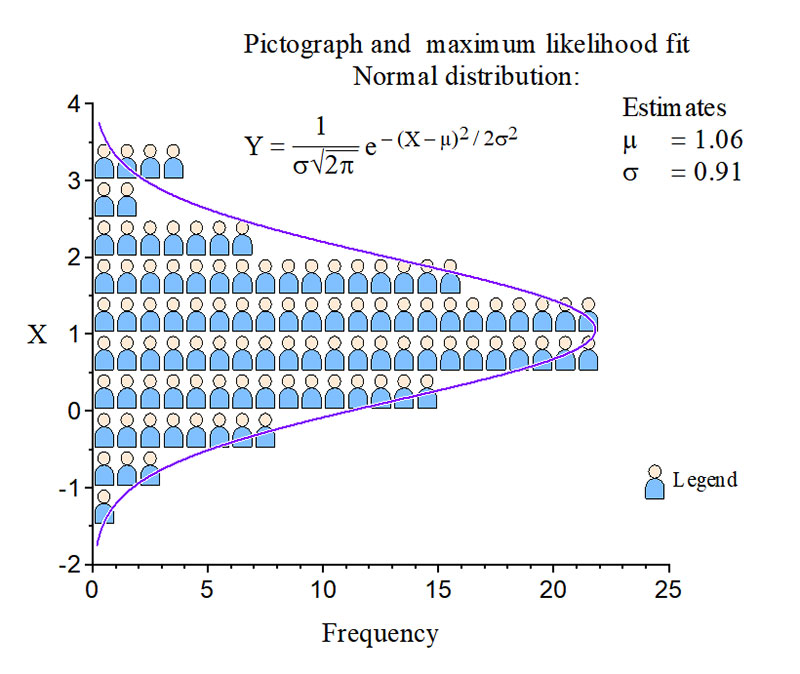
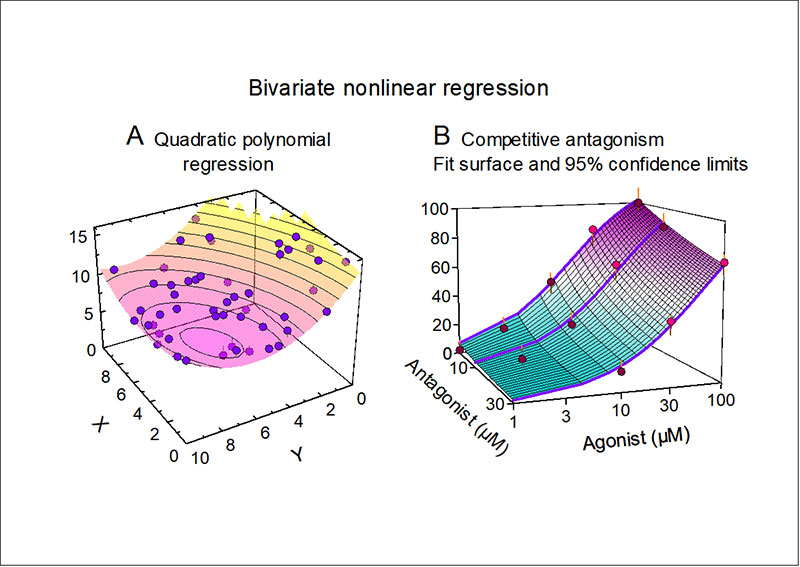
 •Function fits:nonlinear least squares and maximum likelihood methods (2D, 3D)•Polynomial regression (2D)•Piecewise polynomial interpolation (2D)•B-spline fits (2D)•Surface interpolations (3D)•Smoothing spline regression (2D)•Thin plate smoothing spline regression (3D)•Local polynomial regression (2D, 3D)•Wavelet regression (2D)•Fourier series regression (2D)•Local likelihood regression (2D, 3D)•Penalized likelihood regression (2D, 3D)•Local polynomial regression for plane and space curves (2D, 3D)
•Smoothing spline regression for plane and space curves (2D, 3D)
•Histograms and freaquency polygons (2D, 3D)
•Kernel density estimation (2D, 3D)
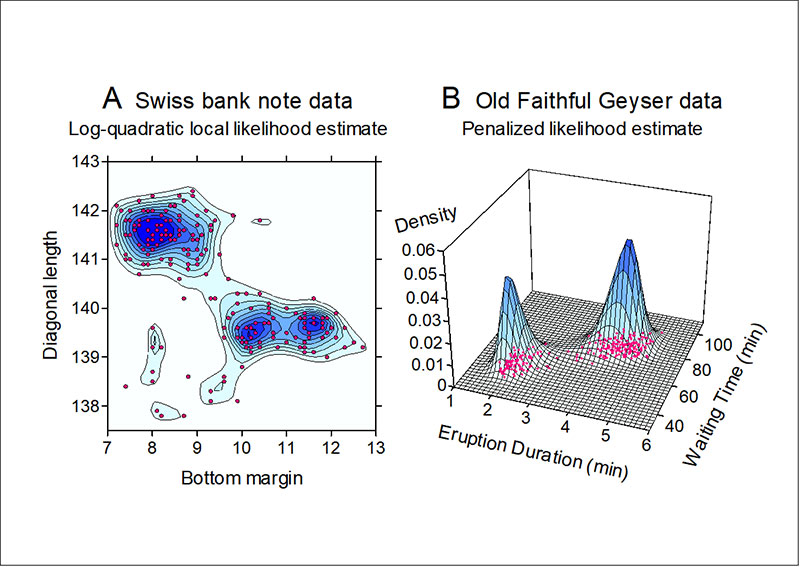
•Local likelihood density estimation (2D, 3D)
•Penalized likelihood density estimation (2D, 3D)
•Parametric curve interpolation (2D, 3D)
Function plot
 •Cartesian univariate function curve (2D)
•Cartesian parametric plane curve (2D)
•Cartesian bivariate implicit function curve (2D)
•Cartesian parametric space curve (3D)
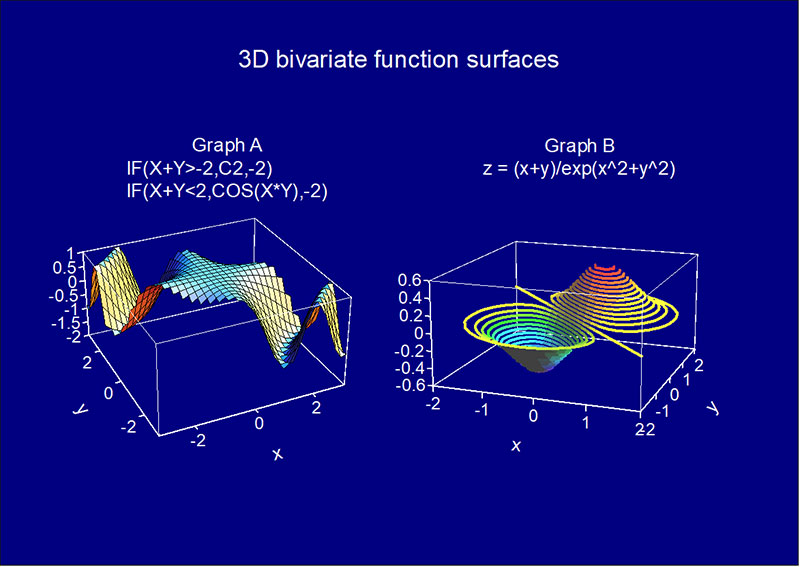
•Cartesian bivariate function surface (3D/2D)
•Cartesian parametric surface (3D)
•Polar univariate function curve (2D)
•Polar parametric plane curve (2D)
•Polar bivariate implicit function curve (2D)
•Cylindrical parametric space curve (3D)
•Cylindrical/Polar bivariate function surface (3D/2D)
•Cylindrical parametric surface (3D)
Drawing
 •It is possible to draw a line, a B-spline curve, an ellipse, a polygon, a text, etc., grouping, and aligning with the mouse only. You can also set the size and position of the shape numerically to create an accurate picture.•In the editing of text, you can set it freely like a word processor software such as superscript, subscript, and line spacing, and you can write a formula.•You can import or export diagrams and graphs in the following formats:Windows meta file (wmf), Enhanced meta file (emf), Windows bitmap (bmp), JPEG (jpg), TIFF (tif), Portable Network Graphics (png), Photoshop (psd), Encapsulated PostScript (eps, only raster format)
GALLERY